
Monitoring task and sensing route
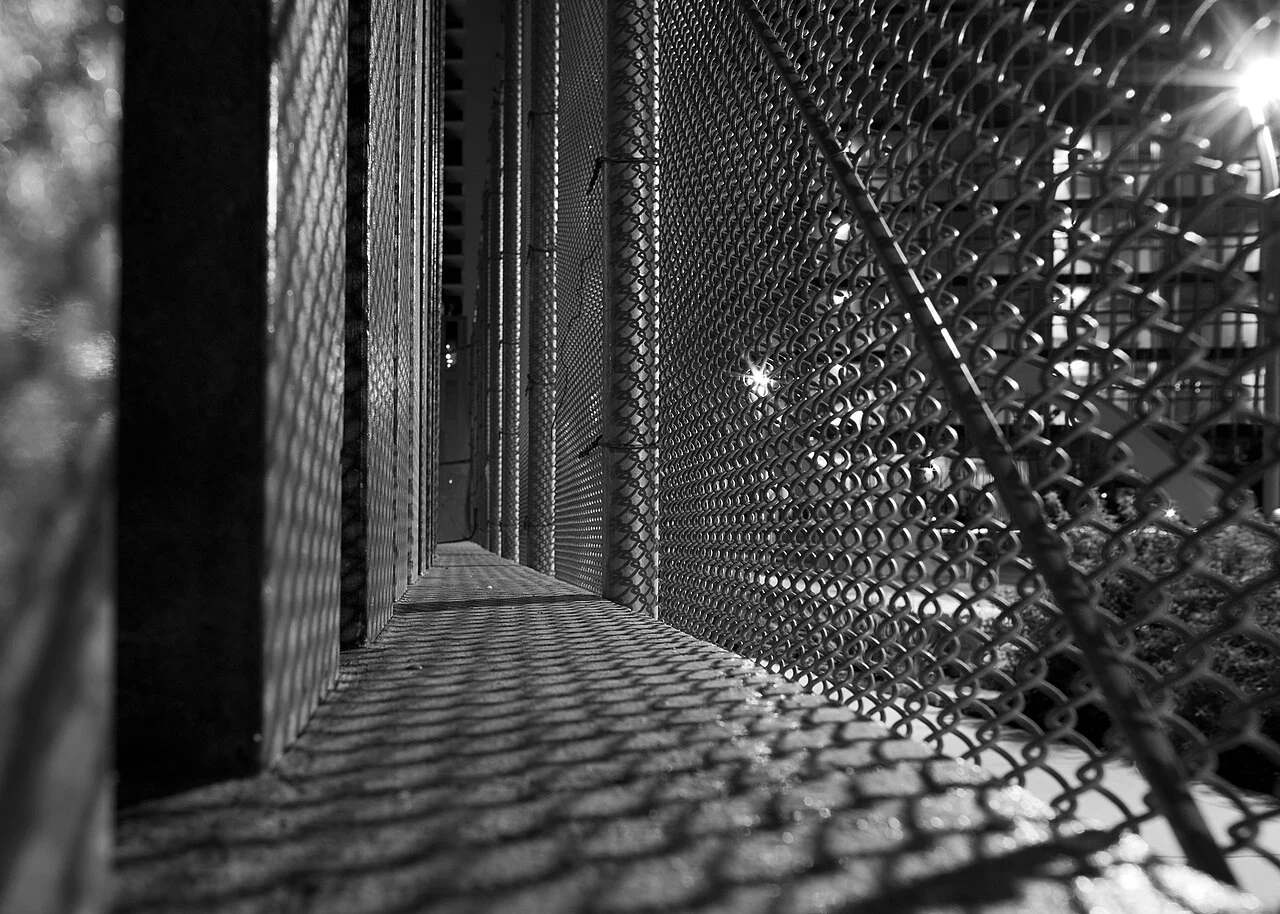
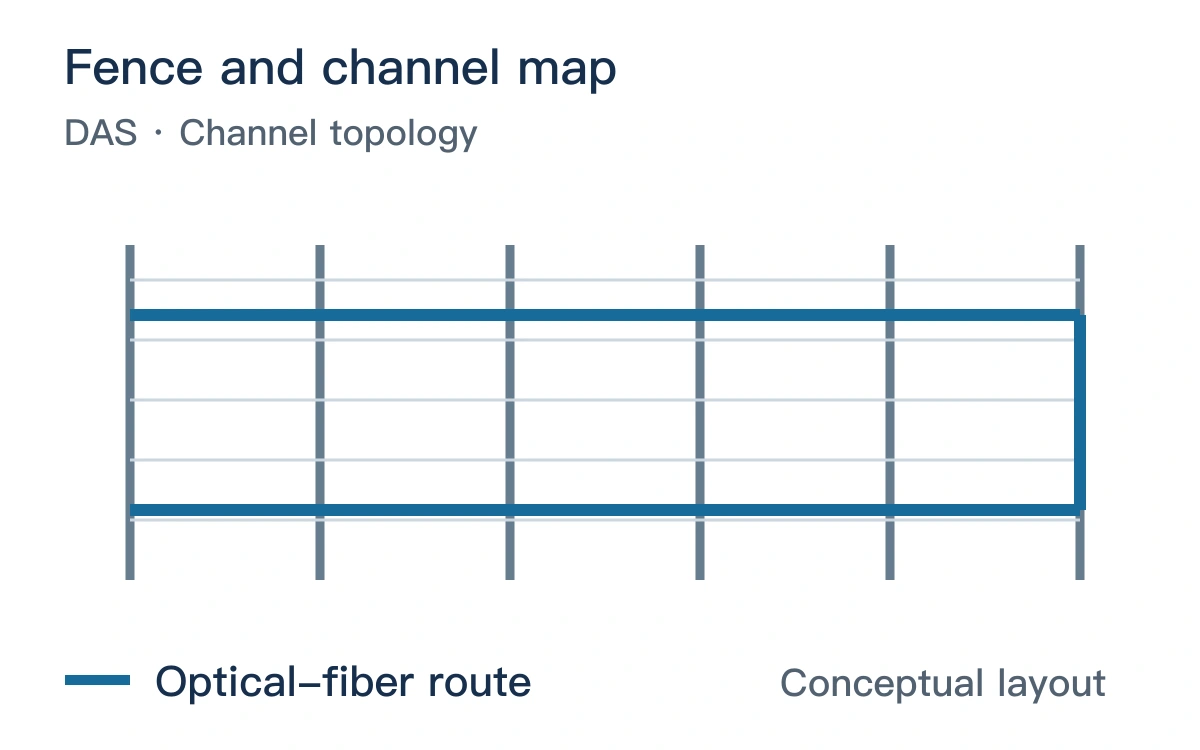
Nearby fiber distances do not always represent nearby fence locations, particularly with return loops or different installation heights. Channel-to-site mapping should precede analysis.
Published research observation
Jeong and colleagues combined channel-graph structure and temporal modeling for anomaly detection using controlled fence-activity data. [1]
| Item | Description |
|---|---|
| Study setting | Controlled fence-activity experiments |
| Research observation | Spatial channel relationships support anomaly analysis |
| Proposed comparison | Document upper, lower and return fiber paths, attachments and slack sections. |
Validation and integration priorities
Retain weather, traffic and normal-work backgrounds with independent activity logs.
Split tests by independent event and date; report false alarms, missed events and processing latency separately.
Reference
[1] Jeong S et al. Spatiotemporal Anomaly Detection in Distributed Acoustic Sensing Using a GraphDiffusion Model. Sensors (Basel, Switzerland) (2025). DOI: 10.3390/s25165157.