
Estimate water velocity from pipe-wall vibration
Pressure fluctuations in turbulent water excite the pipe wall. A coupled optical fibre converts that deformation into a measurable optical phase change. In a study published in 2025, Zhang and colleagues combined large-eddy simulation with a water-loop experiment to calibrate the standard deviation of phase difference against velocity and examine consistency across sensing points. [1]
Calibration measurements covered 0.61–2.42 m/s. Reference-noise processing raised the minimum R² among the compared points from 0.962 to 0.997. In a subsequent comparison, the authors reported an inter-point difference of 0.84% at 2.35 m/s, while the maximum difference at 0.78 m/s remained 22.5%. These results describe different metrics and flow conditions. [1]
Combine pipe coupling with a ground reference
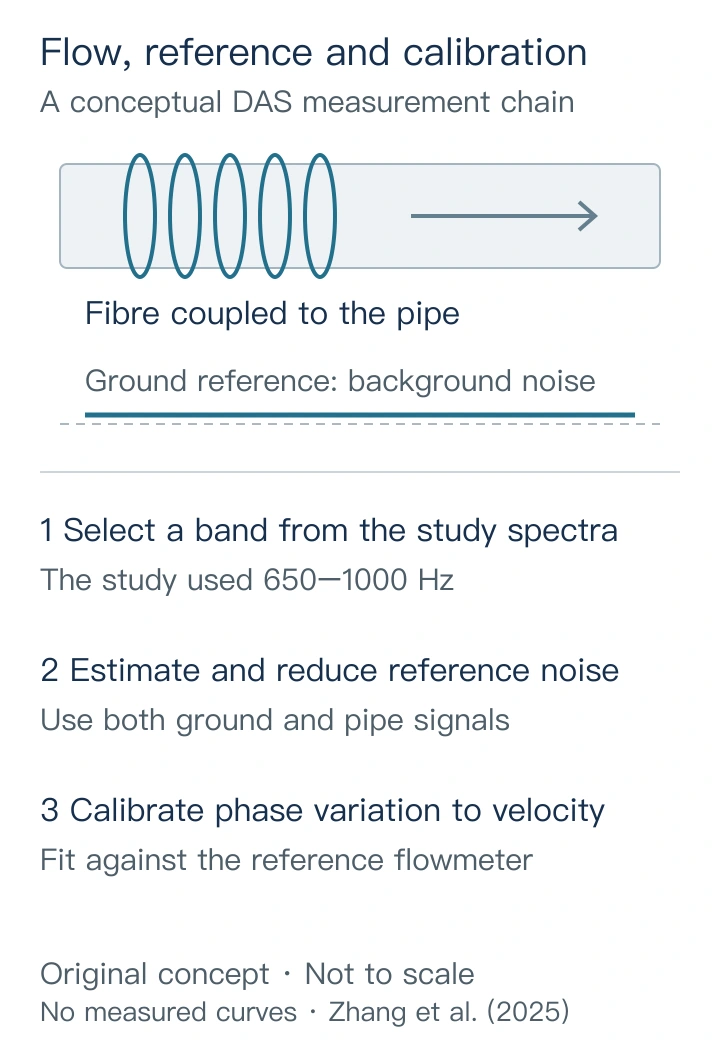
The experiment used a 3 m PVC water loop with a diameter of 25 mm, a valve to regulate water velocity and a reference flowmeter for calibration. The team wound a custom enhanced-backscatter microstructured fibre containing 11 sensing points around the pipe, with another section attached to the ground to record background vibration. Interrogation used phase-sensitive OTDR-based DAS. [1]
The stated 5 m spacing follows the fibre coordinate, with the fibre wound onto a short physical pipe section. Each velocity condition had ten 10 s records. After comparing the spectra of flow-induced vibration and background noise, the authors selected 650–1000 Hz and used the reference signal in a recursive least-squares estimator followed by spectral subtraction. [1]
Separate calibration fit from inter-point variation
The paper first reports calibration at 0.61–2.42 m/s, then compares readings across all 11 points over 0.78–2.47 m/s. R² describes how the calibration curve fits the data; inter-point variation describes spatial consistency at a common flow condition. Reporting them separately keeps the effect of velocity and noise visible, including the larger difference at low velocity. [1]
| Item | Result and condition |
|---|---|
| Fit data | 0.61–2.42 m/s in a 3 m PVC water loop of 25 mm diameter. |
| Check | 0.78–2.47 m/s; readings from all 11 optical sensing points. |
| Min. R² | 0.962 before processing and 0.997 after processing among compared points: calibration fit. |
| Higher flow | At 2.35 m/s, the reported inter-point difference was 0.84%. |
| Low flow | At 0.78 m/s, the maximum inter-point difference was 22.5%. |
Validate the pipe section, spectrum and reference metrology
The study brings mechanical coupling, a background reference and calibration into one measurement chain. For a similar research or integration task, the protocol can define pipe material, diameter, supports, fibre winding, pump and valve states, while recording the reference instrument simultaneously. Those conditions affect the vibration transfer path and background spectrum.
A validation programme can cover low velocity, transitions and steady turbulent conditions, reporting calibration residuals, error against the reference, inter-point variation and day-to-day repeatability separately. Select the band from local spectra and place the reference to represent background vibration while limiting flow-signal pickup. Data held out by day or pipe section can test transfer of the calibration. These are follow-on trial-design implications.
The original work used enhanced-backscatter fibre and a controlled water loop. Different pipe materials, burial conditions or fluids require corresponding coupling and calibration relationships, together with traceability and uncertainty information for the reference measurement. [1]
Reference
[1] Keqing Zhang, Baoqiang Yan, Hao Li, Junliang Lin, Jie Wu, Zhijun Yan and Qizhen Sun High-Precision Flow Rate Measurement Based on Distributed Optical Fiber Acoustic Sensing. Photonic Sensors 15, 250313 (2025). DOI: 10.1007/s13320-025-0705-0.